Inside the 2025 P2P Top 30
- Chapter I: Growth Is Personal, Patient, and Real
- Chapter II: The Flat Sector Myth
- Chapter III: Don't Blow Up Your Community
- Chapter IV: Investing In Community Is Growth
- Chapter V: What This Means For You
- Chapter VI: The People Behind the Revenue
- Chapter VII: Activation Is Partly a Design Choice
- Chapter VIII: People Are the Strategy
- Postscript Coming Next
Growth Is Personal, Patient, and Real
I wanted to write a short post to amplify Natalie Stamer’s excellent keynote at the Peer-to-Peer Professional Forum Conference, the annual gathering of peer-to-peer fundraising professionals that took place in Baltimore in late February.
I wanted to, that is, but unfortunately I missed the conference! Winter travel challenges defeated my best attempts to get there in person.
Sensing my FOMO, Natalie — the CEO of Streetlight Digital and someone I’m fortunate to call a colleague and grateful to consider a friend — was kind enough to send me the text of her speech.
While I know it was even better in person, I loved reading it. It’s full of the character, intelligence, and passion that characterize Streetlight’s work and Natalie’s leadership.
Ironically, Natalie opened by saying she couldn’t find the story in this year’s peer-to-peer fundraising data. But then she went on to tell a beautiful one – about her daughter, a competitive swimmer who spent 2,600 hours in the pool over two years, working day after day, week after week, without any visible improvement.
Then, at a December meet, sick with the flu, dragging through warm-ups, her daughter stepped on the block, swam the race of her life, and touched the wall with a new best time.
Natalie used her daughter’s journey as a metaphor for both the P2P community and for this year’s results. The Top 30, the index of the largest peer-to-peer fundraising programs, grew 3% this year and 3% the year before. And while 3% doesn’t make headlines, she made the case that it represents perseverance through small, incremental improvements, relentless focus on doing the right thing when it’s hard, and resilience in the face of setbacks that would make most of us quit.
I just love this point, and I love the way she made it. I’d summarize it this way: growth is personal, patient, and real.
I had a chance to look more deeply at the U.S. data, also released yesterday, and the story it tells reinforces everything Natalie said, and then some. Because once you look underneath the surface of the Top 30 numbers, you see that there is a lot more growth in the sector than we give ourselves credit for.
Going Deeper
- Peer-to-Peer Professional Forum. The home of the P2P Fundraising Top 30.
- Streetlight Digital. Sponsor of the Peer-to-Peer Fundraising Top 30 Survey.
- Subscribe to our newsletter. Get notified when new chapters of this Data Deep Dive go live.
The Flat Sector Myth
I appreciated that Natalie took pains to point out the growth in the sector, because the conventional wisdom about peer-to-peer fundraising is that the sector is stagnant. As I’ve written elsewhere, I’m sitting in on a growing number of strategy sessions during which the executives ask me what they should do about exiting peer-to-peer "because the sector isn’t working anymore.”
It’s a compelling narrative, but it’s wrong.
The overall gross revenue of the Top 30 has hovered around $1.5 billion for the last 20 years or so. But that total conceals a dramatic story of structural change. To see it, you have to look past the sum to see what’s happening inside the number.
The interactive chart above shows the Top 30 dataset on two tabs. The first tab, with the gray bars, shows the entire index. When you look at it, the sector truly does look stagnant.
However, on the second tab, I’ve split the Top 30 index into two groups: the “mega-decliners” and the remaining programs.
The “mega-decliners” are four once-mighty campaigns: Relay For Life, March for Babies, Race for the Cure, and the Komen 3-Day. In 2006, those four programs accounted for over half of the index’s total revenue. At one point, they reached nearly $800 million in total. Today, they bring in roughly $120 million. That’s a decline of over 80%.
The rest of the Top 30, however, has steadily grown and just hit an all-time high of nearly $1.4 billion.
Said again: excluding a handful of once-dominant programs that declined sharply, the peer-to-peer Top 30 is at its all-time high. (Yes, those are nominal dollars, and yes, the membership of the index, like all indices, changes over time. I’ll address both of those dynamics in subsequent chapters to come in March.)
The growth has been hidden by a few enormous declines that drag the average down.
Like a forest fire that takes down some of the oldest growth and leaves room for a variety of young saplings, the sector isn’t flat. There is significant new growth, but it is offset by equally significant losses.
Explore
- Is your strategy actually a strategy? The Ariadne Strategy Framework helps you find out.
- The "Strategy For What's Next" series. Our 7-part series on strategic planning for nonprofits.
- Create better peer-to-peer campaigns with our free ebook.
Don’t Blow Up Your Community
So what happened to those once-dominant programs? The declines didn’t happen overnight, and they didn’t happen for the same reasons. But there’s a common thread worth paying attention to.
One point I’ve tried to make over the last 20 years is that strategy matters to fundraising, and culture matters to strategy. And, most importantly, community dictates culture.
When I am asked to assess fundraising challenges, I look upstream. Is the strategy focused and coherent? And if there are strategic issues, I look further upstream and ask, is the culture vibrant and values-aligned?
In other words, peer-to-peer is about people more than it is about tools and tactics. Although the right tools and tactics can really help you grow, if you don’t have engaged people, you’ve got nowhere to go.
Once you start making short-term optimizations that endanger your community in the long term, you’re putting your entire organization in jeopardy.
You can see it in the second chart above. It isn’t popular to say, I guess, because there’s very little public discourse about this. But there are once-larger organizations that made short-sighted decisions that absolutely gutted their communities. They took their supporters for granted, gutted the staff whom their supporters cared about, and rapidly destroyed the communities that did most of the heavy lifting.
If you reorganize and close all your local chapters — which might look great on a slide deck — who will support your participants? If you cut your field team and move them to a call center — which is a great idea for a one-year financial statement — who will build relationships? Who will know the name of your top fundraiser’s top five donors? Or their deceased relative who inspires their work? Or even the fundraiser’s name?
Relay for Life went from $438 million in 2008 to $62 million today. That’s an 86% decline. The Komen programs combined peaked above $240 million and now bring in about $34 million. March for Babies peaked at $116 million and now raises $24 million.
These organizations didn’t lose to a competitor. They didn’t get disrupted by technology. A few people at the top made management and branding decisions that were out of step with their field staff, partners, and communities — and their communities left. (None of this, by the way, is intended as a criticism of the staff now currently at those programs, working hard to reinvent and retool. In almost every case, the senior executives responsible are long gone, and a new generation of leaders is working to rebuild.)
And so, when I hear, “We need to exit the sector because the sector is flat,” it concerns me on two fronts. First, the sector isn’t flat. It looks flat because of a few avoidable self-imposed implosions. And second, because the statement reminds me of exactly the kind of short-term thinking that leads to massive erosion in value.
If you are a fundraising professional concerned about your own peer-to-peer program, its value to your organization, and the overall health of the sector, one of the most important things you can do for your cause and your career is to learn how to manage upwards. The dynamics of peer-to-peer fundraising are still not well understood at the executive level of many organizations, nor is the fact that peer-to-peer is the foundation of most development efforts. We have to be the ones to make the case.
Build
- The Community You'll Need In Five Years. Why now is the time to invest in the people you need later.
- The Radiance P2P Model. Our framework for building peer-to-peer programs from the inside out.

Investing In Community
Now let’s look at the other side of the ledger. Look at the organizations that have consistently invested in the community rather than cut it.
Above, you can explore both events over time. The bars represent the total number of participants, and the line represents total revenue. I’ve found that participant totals overall tend to be suspect, so I’d consider these “directionally correct” rather than “absolute facts.”
The Alzheimer’s Association Walk to End Alzheimer’s has grown from $30 million in 2006 to $112 million in 2025. That’s nearly four times its starting size, with twenty years of steady, patient growth, through every headwind this sector has faced. It is one of the greatest success stories in peer-to-peer fundraising history. (And runs directly counter to the prevailing narrative that "walks are dying.")
I’m proud to have had a seat at the table back in the early days, and I’m grateful that their thoughtful, forward-looking leaders were more interested in how to build patiently, from the inside out, than in get-rich-quick schemes. They took the long view, and it shows.
The Pan-Mass Challenge has grown from $28 million to $88 million over the same period. It’s an elite cycling event that has built one of the most loyal fundraising communities in the country. It has done so by investing deeply in the experience, the relationships, and the sense of shared purpose that bring riders back year after year.
What do these programs have in common? It’s about the tribe. They didn’t chase efficiency at the expense of community. They didn’t centralize their way to growth. They built grassroots infrastructure and then protected it. They invested in the people who carry out their mission, and those people rewarded them with decades of compounding growth.
Unlock Growth
- Start with community, not tactics. Our Radiance P2P Model will help you clarify your mission, identify your most important constituents, and energize them to engage others.

What It Means For You
I realize I’m painting with a broad brush here. There’s lots more to the peer-to-peer sector than six campaigns, and there’s lots more detail about why these four campaigns ate themselves (including self-inflicted PR wounds, odd mission decisions, strange branding choices, and so forth) and why these two campaigns grew.
Just as the quick storyline that “the sector is flat” hides quite a bit of more informative detail, the storyline that "campaigns have a natural life cycle” doesn’t really describe what’s happening. Sure, some campaigns, like some companies, grow, plateau, and decline. But some continually reinvest, listen, and grow.
The management choices matter a lot.
More broadly, Natalie’s point was that this community has been building, step by step, margin by margin, hundredth by hundredth, through every storm. The data confirms it emphatically. There is more growth in this sector than the top-line number suggests.
The data also shows us something else: where that growth comes from.
Growth doesn’t come from efficiency drives. It doesn’t come from cutting field staff. It doesn’t come from consolidation. It comes from people — real, human, face-to-face, know-your-name-and-your-story community.
For more details, I’d invite you to look at our new peer-to-peer framework, Radiance. It’s designed to help you start at the center and make smart choices about how to build from what matters most. P2P isn’t a fundraising tactic. It’s a community strategy with fundraising outcomes. When you get that distinction right, everything shifts.
Ten years from now, the organizations that will be at the top of the 2035 Top 30 are the ones making community investments now, when it’s hard, when the ROI is uncertain, when it would be easier to just cut the line item and move on.
To come back to Natalie’s wonderful story about her daughter, we, as a sector, don’t need to look for a story. We have a positive story. We have to learn how to tell it better.
Connection
- Connection is how your cause finds its voice. Philanthropy exists precisely because people choose to connect even in times of distance and disconnection.
- The connection between revenue and personal growth. You matter in this, too.
- Work with us. Let's talk about your P2P strategy.
The People Behind the Revenue
One of the things I love about a rich dataset is that it lets you test your assumptions. In peer-to-peer fundraising, we carry around a lot of assumptions about how programs work — what drives revenue, what "good" looks like, how to grow, and so forth. Some of those assumptions hold up over time, and some of them don't.
The 2025 Top 30 dataset covers 109 events from 65 organizations. Of those, 102 report participant counts, which lets us test a critical question: All things being equal, do more participants equate to more revenue?
The short answer, as you might expect, is "yes." But the longer answer is, "Yes, but it depends," and how it depends is where it gets interesting.
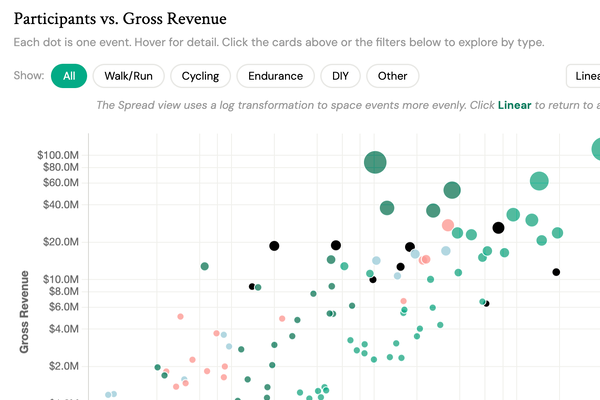
The chart below plots every event that reported participant data. Each dot is one event. The horizontal axis is participant count; the vertical axis is gross revenue. Bigger dots represent larger programs.
The colors represent event types: green for Walk/Run, dark green for Cycling, pink for Endurance, and blue for DIY.
Because some programs are huge, they dwarf the others in the graph. So using log transformations, we adjust the scale of the graph and make things easier to see. Click "Spread" and the relationships should become very easy to see (and conversely, click "Linear" if you want to see the raw scale before the adjustment.)
Click the "Spread" button and watch the magic happen. See how everything goes up and to the right? That’s showing you the basic truth: the more participants you attract, the more money you raise. In fact, the differences in participants alone account for about half of the variance between all the revenue results. It's quite strong.
However, there's more to the story. Each kind of event type has different dynamics, and in some cases, you can't keep endlessly adding participants. Clicking each event type will filter the graph and allow you to see the relationships in more detail.
The five cards across the top describe the statistical relationship between participants and revenue for each event type. "Strong, Nearly Linear" means that participant count is a reliable predictor of revenue and the relationship is nearly proportional — add people, get dollars. "Strong, Diminishing" means participant count still predicts revenue well, but with steep diminishing returns — you’d need to quadruple participants to double revenue. (The R² and β values at the bottom of each card are the underlying statistics for readers who want them.)
There is, as you would think, a positive relationship between participants and gross revenue. More people generally means more money. But the scatter is enormous. Some programs bring in tens of millions with a few thousand participants. Others have tens of thousands of participants and raise a fraction of that.
The relationship is real, but it's messy — and the messiness is the story.
Try clicking the cards to filter the chart by event type. When you look at all 102 events together, the relationship between participants and revenue is moderate. When you filter by event type, the picture sharpens dramatically. Within Walk/Run events, the relationship is strong and nearly linear. Within DIY programs, it’s almost perfectly predictable.
Again, if most of your events are clustered in the bottom-left corner and you can’t see them clearly, click “Spread” to space things out. (As noted above, this applies a log transformation that gives smaller events more room on the chart.)
What explains the variation in performance? Two things, primarily: who your participants are, and what you’re asking them to do. And that’s the next section.
Going Deeper
- Subscribe to our newsletter. Get notified when new chapters of this series go live, resources are published, and more.
- The Radiance P2P Model. Our framework for mobilizing participants and building long-lasting communities.
Activation Is Partly a Design Choice
Not all participants are fundraisers. In a walk event, you might have 50,000 people show up, but only a fraction of them actively raise money. In an endurance event, nearly every participant is a fundraiser. That’s the deal: you commit to a ride or a race, and you commit to raising a required minimum.
We call this percentage activation — the share of participants who actively fundraise. Activation varies wildly across event types.
Walk/Run events in the Top 30 have a median activation rate of about 39%. That means that for every 10 people who register, only four actively fundraise. Cycling events come in closer to 73%. Endurance programs are often near 89%.
This isn’t an accident. It's a function of event design.
The chart above shows the median event gross output per participant for each event type. Note, this isn’t what any individual participant raised. Rather, it’s how much total revenue each program generated for every person who showed up. In other words, it’s a measure of program efficiency. (The cards across the top show the same numbers, and the footnote below the chart explains the methodology in more detail.)
The variation is striking. DIY programs generate a median of $3,008 per participant. Walk/Run events: $275. That’s more than a 10× difference, and it’s almost entirely a function of pricing strategy and activation.
Longer, harder events can impose fundraising minimums. In other words, you can’t participate unless you raise a threshold amount. That gate guarantees higher revenue per participant but suppresses volume. Pan-Mass Challenge generates $88 million from 10,200 riders ($8,627 per participant). Making Strides generates $51 million from 931,000 walkers ($55 per participant). The activity creates the gate.
Neither model is “better.” Walk events have enormous reach; the Walk to End Alzheimer’s alone involves over 400,000 participants. Endurance events are smaller but generate more per person. They’re different strategies with different growth dynamics.
Be careful mixing the two! It’s very, very difficult to cultivate high volume with a high barrier. At the same time, a low-barrier event requires a high volume of participants to recoup the investment.
Here’s the strategic question: if your walk event is generating $275 per participant and you’re wondering how to grow, is the answer more walkers? Or is it more coaching, more tools, and more support to help the walkers you already have raise more?
The implications are significant. If you’re running a walk program, you have two levers: get more people, or activate more of the people you already have. Most programs focus almost exclusively on the first lever. The second one is often cheaper and more effective. (At More For Many, we use a proprietary scenario model to help you decide between one approach or the other, or a mixture of both.)
The organizations that consistently outperform don’t just recruit well. They empower their participants to ask. They coach them. They give them stories, tools, and confidence. That’s the difference between handing someone a fundraising page and teaching them how to use it.
Improving Activation
- Sharpen your messaging. Our Ariadne Strategy Framework can help you set a crisp, clear, motivating mission to engage your participants.
- Need something more inspiring? Our messaging and branding workshops can help you turn what sounds stale into messages that inspire.
People Are the Strategy
Here’s what I take from all of this.
First, the relationship between participants and revenue is real, but event design profoundly shapes it. The same number of participants can produce wildly different revenue depending on what you’re asking them to do and how you support them in doing it.
Second, efficiency metrics often matter more than top-line metrics. Revenue per participant tells you more about program health than gross revenue does. A $5 million program generating $2,400 per participant may be in a fundamentally stronger position than a $20 million program generating $275 per participant — because the first one has already solved the harder problem of getting people to fundraise at a high level.
That said, acquiring one new participant who will raise $2,400 might be much harder than acquiring ten new participants who will raise $275! You have to be intentional about the approach.
Third, and most importantly: the people are the strategy. Not the platform, not the t-shirt, not the email sequence. The people.
In our Radiance P2P framework, we organize the P2P work into three phases: Design, Mobilize, and Multiply. The data in this post maps directly to the Mobilize essentials: recruit your evangelists, empower them to ask, and ignite the network. The programs that do these well show up in the efficiency metrics. The programs that skip them don’t.
Connection
- There's more on the blog! We regularly post engaging pieces that will help you do your work better.
- Work with us. Let's talk about your P2P strategy.
Coming Next
We've updated this page twice since it was published, and there's still more to say.
In the coming weeks, we'll be adding a couple more chapters to this page exploring more of what the Top 30 data reveals:
The Benchmarks We Don't See. 139 events have appeared in the Top 30 over twenty years. Only 109 remain. We’ll dig into survivorship bias, sector concentration, churn, and what the data looks like when you adjust for inflation.
Oh Canada! We’ve started with U.S. events, but our neighbors to the North (near north, here in Michigan) have gone from strength to strength. We’ll look at what’s working.
Check back, or subscribe to our newsletter to get notified when new chapters go live.
Author

About More For Many
We help purpose-driven organizations uncover opportunities, find audiences, spread ideas, and grow impact. Strategy, insight, and inspiration for a generous world.
Sources
Data in this post comes from the P2P Professional Forum’s 2025 Top 30 Survey, sponsored by Streetlight Digital.
The analysis, visualizations, and opinions are © 2026 More For Many, LLC.
From Our Blog
We regularly post practical tools and fresh ideas to sharpen your strategy, unlock insights in your data, improve your fundraising, and spark the inspiration your team needs.
The People Behind the Numbers: Part 2 of the P2P Top 30 Data Deep Dive

Hidden Growth: A Look at the 2025 P2P Top 30
